Krystal said:
Dear Users,
Trading pair AR/USDT will soon be enabled with Trading and MM as mining, starting 15:00 (UTC+8) on Oct 13.
A week of special event to receive 3X market-making as mining rewards for trading pair AR/USDT will also start from 15:00 (UTC+8) Oct 13 and last through 15:00 (UTC+8) Oct 20.
About Arweave
Arweave is a new type of storage that backs data with sustainable and perpetual endowments, allowing users and developers to truly store data forever.
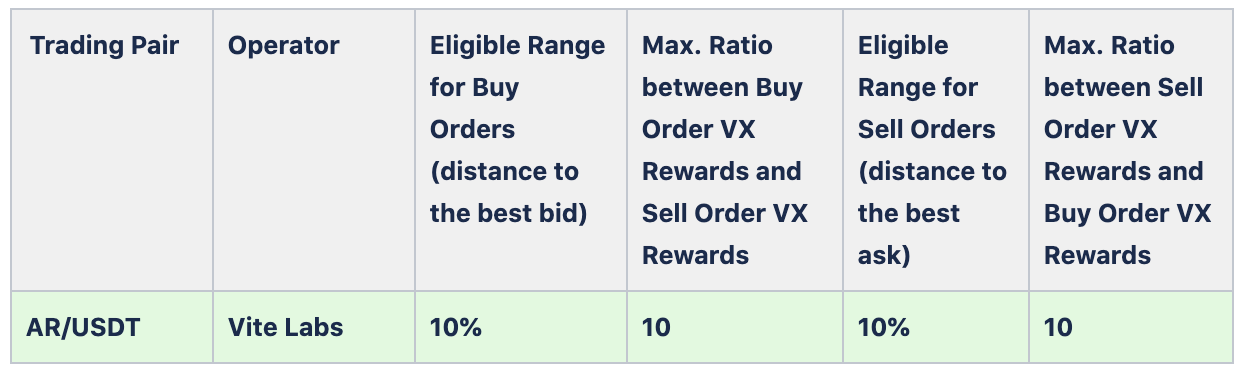
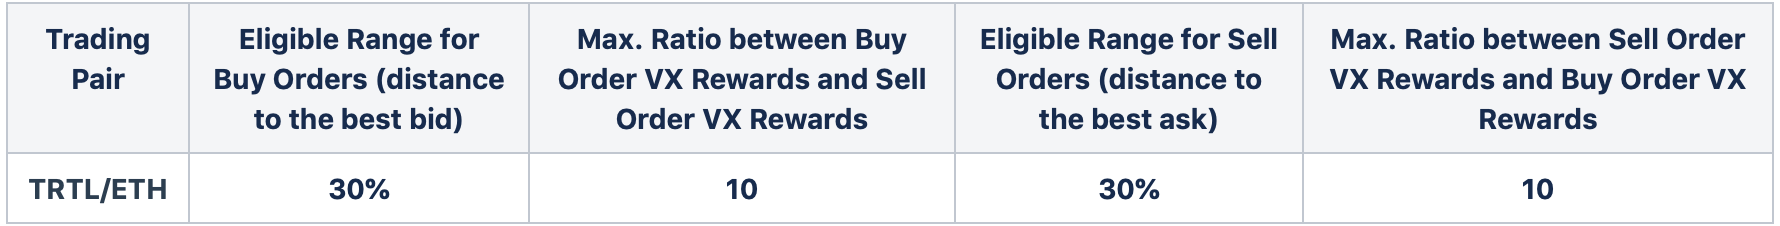
Mining Range
Note:The ratio of VX rewards from buys versus sells is capped. When the ratio hits the cap, if one continues to place buy orders, their VX rewards will NOT be increased.
The ratio of VX rewards from sells versus buys is also capped. When the ratio hits the cap, if one continues to place sell orders, their VX rewards will NOT be increased.
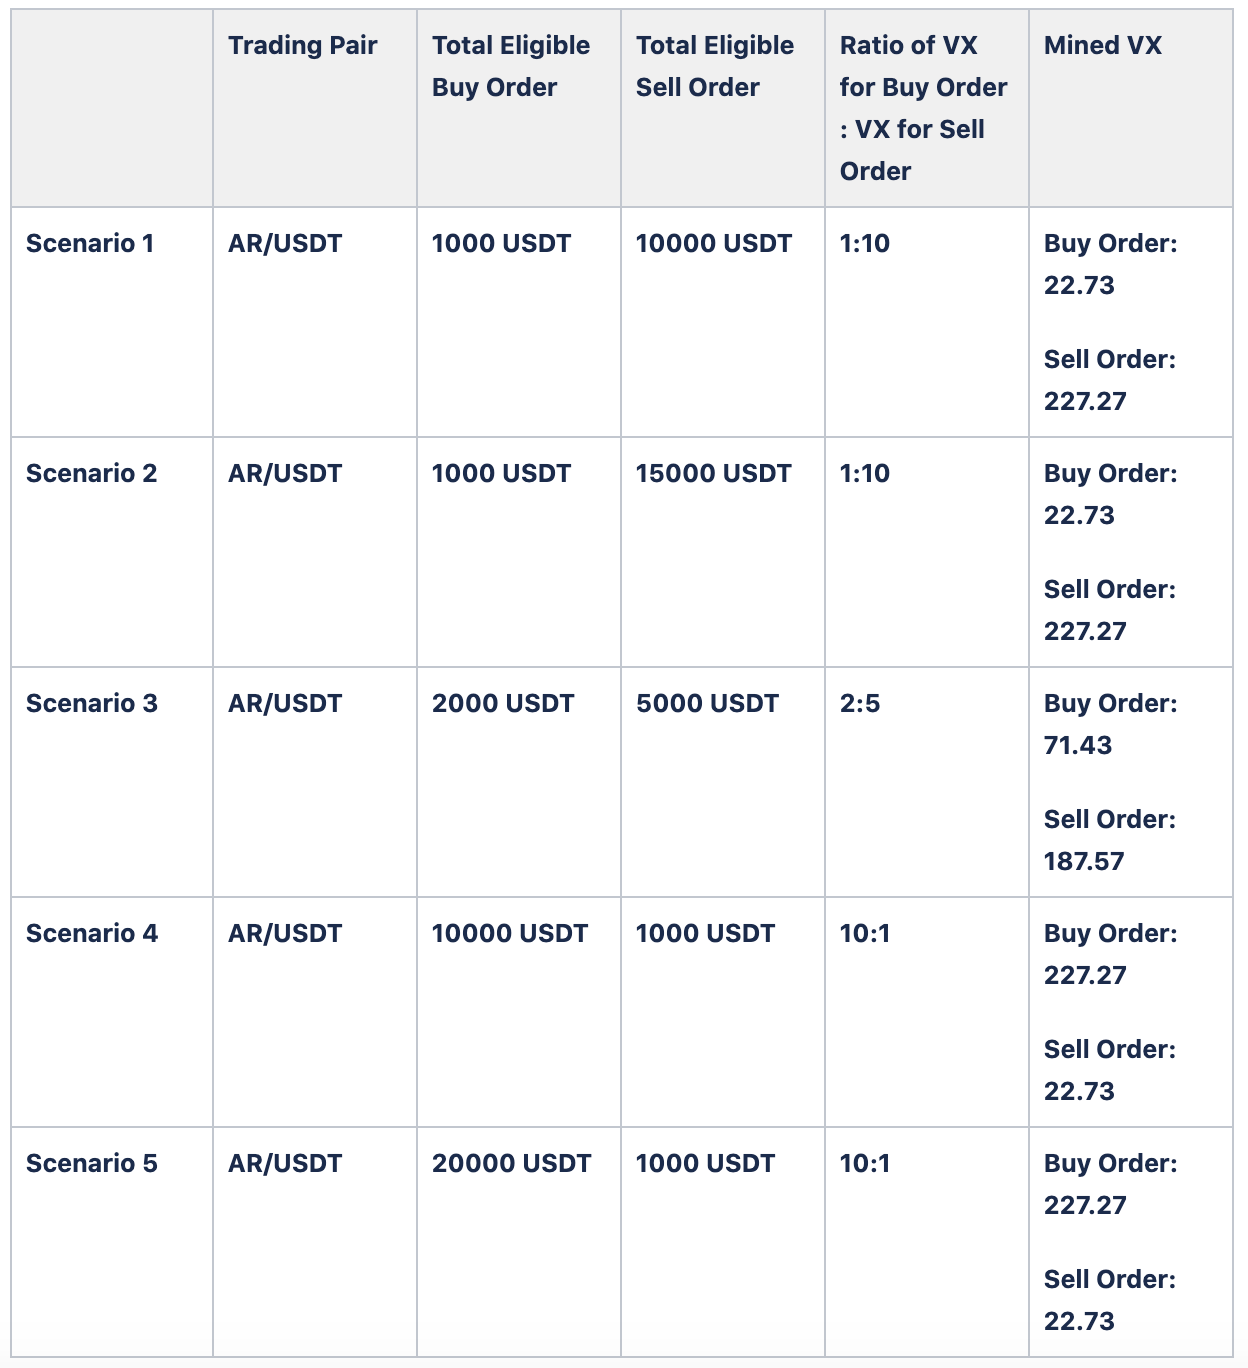
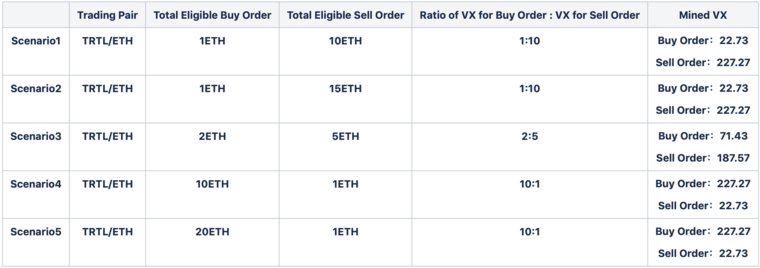
Example
Suppose that the USDT market has only HNS/USDT trading pair and all orders are placed for 24 hours, a total of 250 VX will be allocated as mining rewards. Consider five scenarios as follows:
The mining calculation is conducted as follows:The Base Number of 1 user on one market in a day = the sum of all Base Numbers of every single order of that market. Here, the Base Number (m) is subject to three factors: the order time (T), the order amount (A), and the mining coefficient (y). That is, m = T * A * y (T ≥ 300 seconds)
The sum of the Base Number on one market in a day = the sum of the Base Numbers of all eligible orders on that day. That is, M = m1+ m2 + m3 + .....mn
Mined VX of 1 user = m / M * 2.5% * VX daily released amount on that day
Links:
ViteX website:https://vitex.net/
Vite APP Download:https://app.vite.net/
Twitter:https : //twitter.com/ViteXExchange
Telegram:https : //t.me/vitexexchange
Oct 12, 2020
Team ViteX